Cet article n'est pas disponible en français.
Winners vs Losers
Winners Versus Losers
The society in which we live leaves both positive and negative traces. This means that people must deal with this reality and attempt to adjust to it in an effort to attain a degree of equilibrium or a state of well-being that makes life pleasant or, at the very least, acceptable.
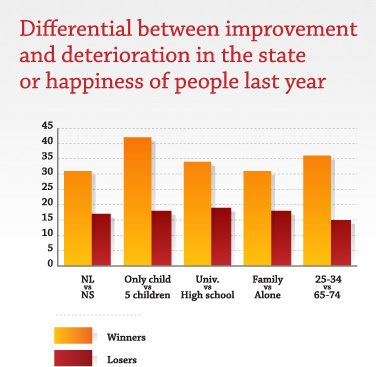
It's a game in which there are always winners and losers. The differential between improvement and deterioration in the state or happiness of people during the preceding year constitutes an excellent method for determining who had the best year or one that was less so.
The chart below pairs the winners and losers in a number of categories. For comparison, you might want to keep in mind that the average Canadian differential is 26.
The Concept of Differential
The concept of differential between improvement and deterioration in the state or happiness of an individual last year is a useful, complementary indication for analyzing the various segments and subgroups in a population, making comparisons between them, and determining which categories in recent months have been the best and worst.
The differential is calculated simply by subtracting the percentage of respondents in a particular group claiming that their state or happiness improved by the percentage of those who indicated that it had not.